eInvoicing growth metrics
The latest eInvoicing statistics for June 2026.
On this page I tēnei whārangi
View image description
View larger versions of the charts and their corresponding data below.
Summary
This special edition report marks the completion of a major accounting software provider's final round of bulk registrations. More than 110,000 New Zealand businesses are now registered to receive eInvoices – an important milestone for national adoption. This has removed a key barrier by making eInvoicing readily accessible through existing accounting software, with around one third of cloud accounting businesses now capable. We expect this step-change to drive increased eInvoice exchange volumes over the coming months.
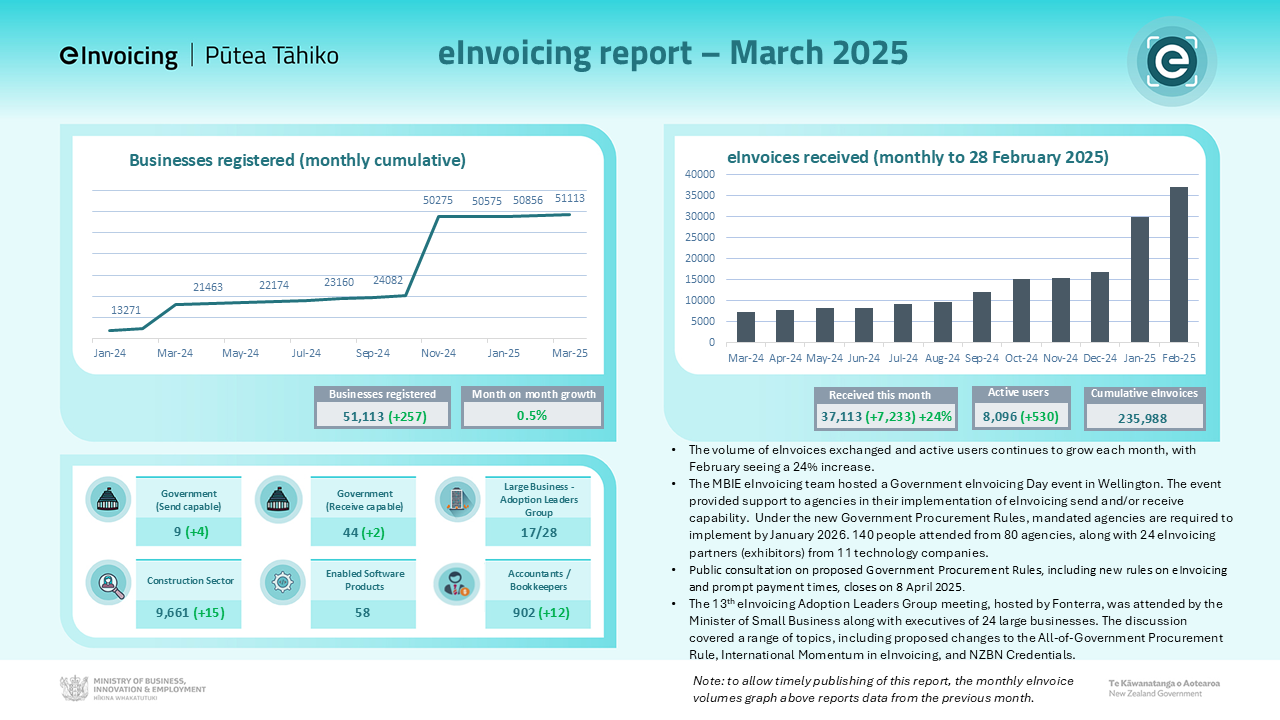
Note: to allow timely publishing of this report, the monthly eInvoices received and active users graphs report data from the previous month.
Total registrations to date
- New businesses registered: 113,970
- Monthly change: 49,436
eInvoices received (monthly)
- Received this month: 52,390
-
Cumulative eInvoices received: 904,594
View chart description and data
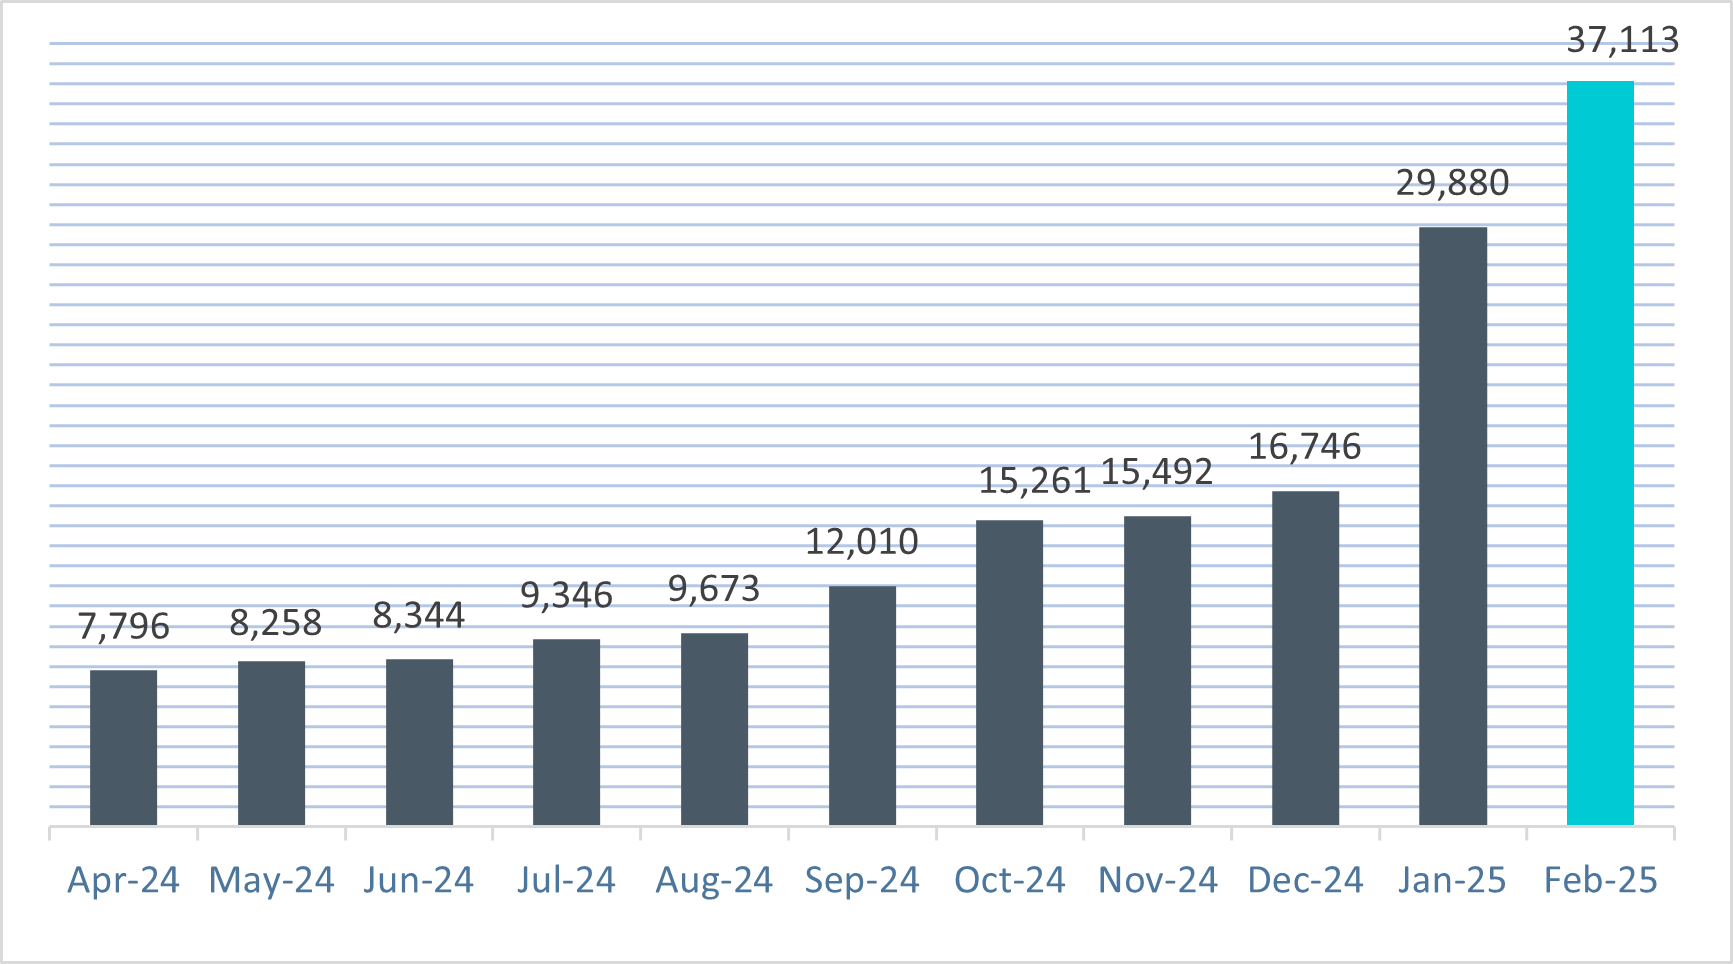
Central government agencies and businesses registered to receive eInvoices
View infographic description and data
Active Users (monthly)
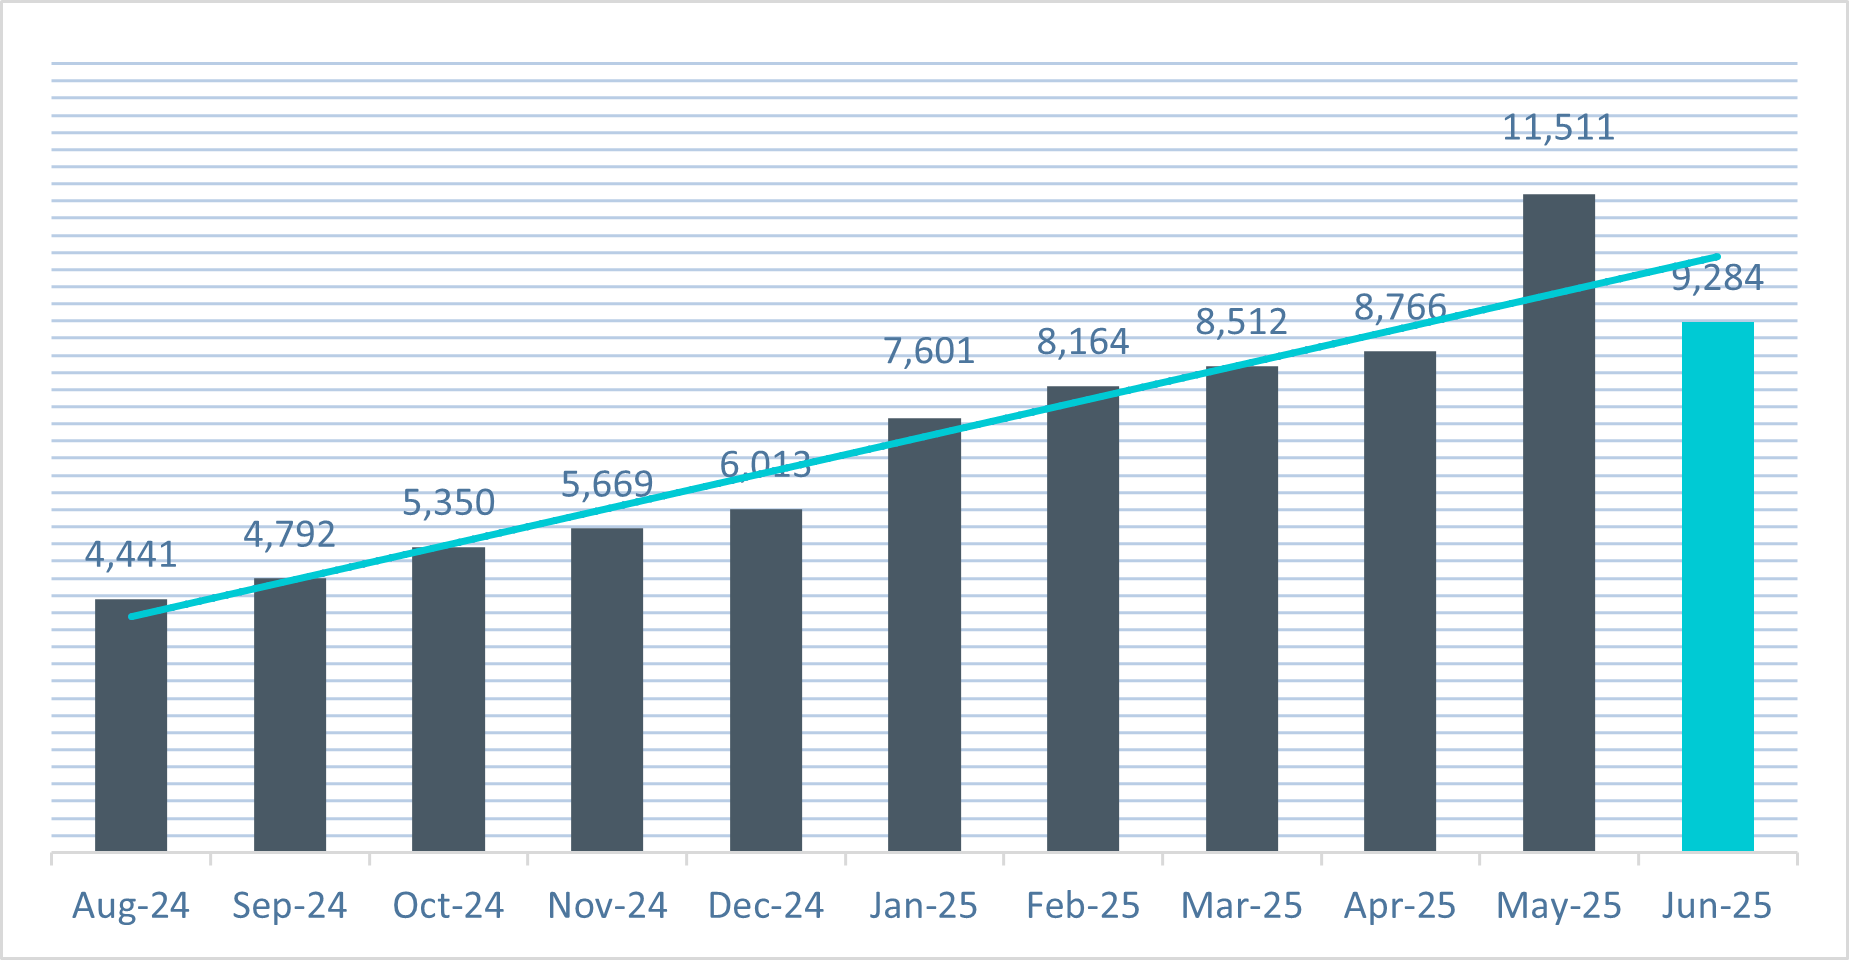
View chart description and data
Sign up, to stay ahead
If you’re a business owner, accountant, business advisor or manager – or you just want to stay in front of the eInvoicing curve – sign up here for email updates, seminar/webinar invitations, and tips to get maximum value from eInvoicing.