eInvoicing growth metrics
The latest eInvoicing statistics for June 2024.
View image description
eInvoicing report graphic for the most recent month showing 2 charts, an infographic, and the following summary text:
- Top left – A line chart showing the monthly cumulative businesses registered to receive eInvoices
- Top right – A bar chart showing monthly eInvoices received across the Peppol network
- Bottom left – Infographic showing the number of businesses registered to receive eInvoices for key sectors/groups
- Bottom right – summary text.
View larger versions of the charts and their corresponding data below.
Summary
-
The eInvoicing team hosted or attended events to promote the uptake of eInvoicing. They included the quarterly government Procure to Pay Community of Practice, the Treasury CFO Forum, the annual NZ Government Data Summit and a webinar for large businesses with an access point provider.
-
Content on the eInvoicing website was reshaped to help users find content more relevant to their unique requirements.
-
The website will be updated with new content and implementation guidance documentation in the coming months. This is in preparation for a pending Cabinet decision which may require up to 130 government organisations becoming eInvoicing receive and/or send capable.
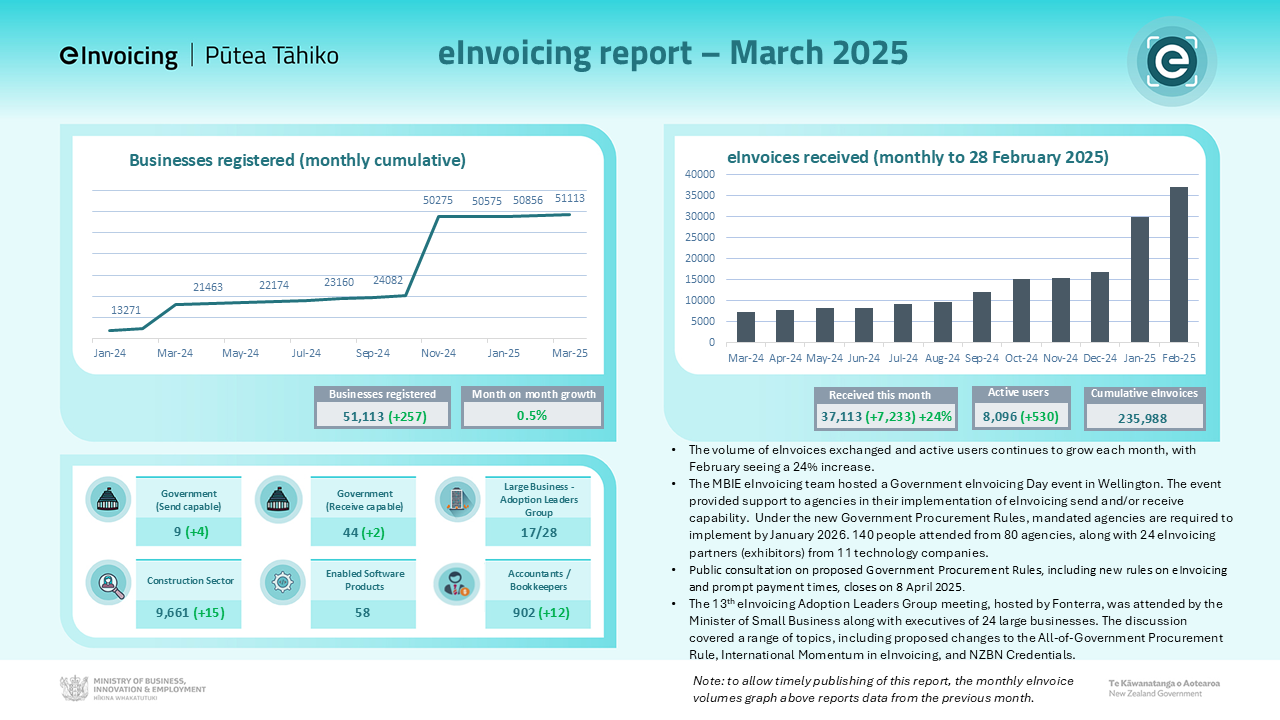
Businesses registered (monthly cumulative)
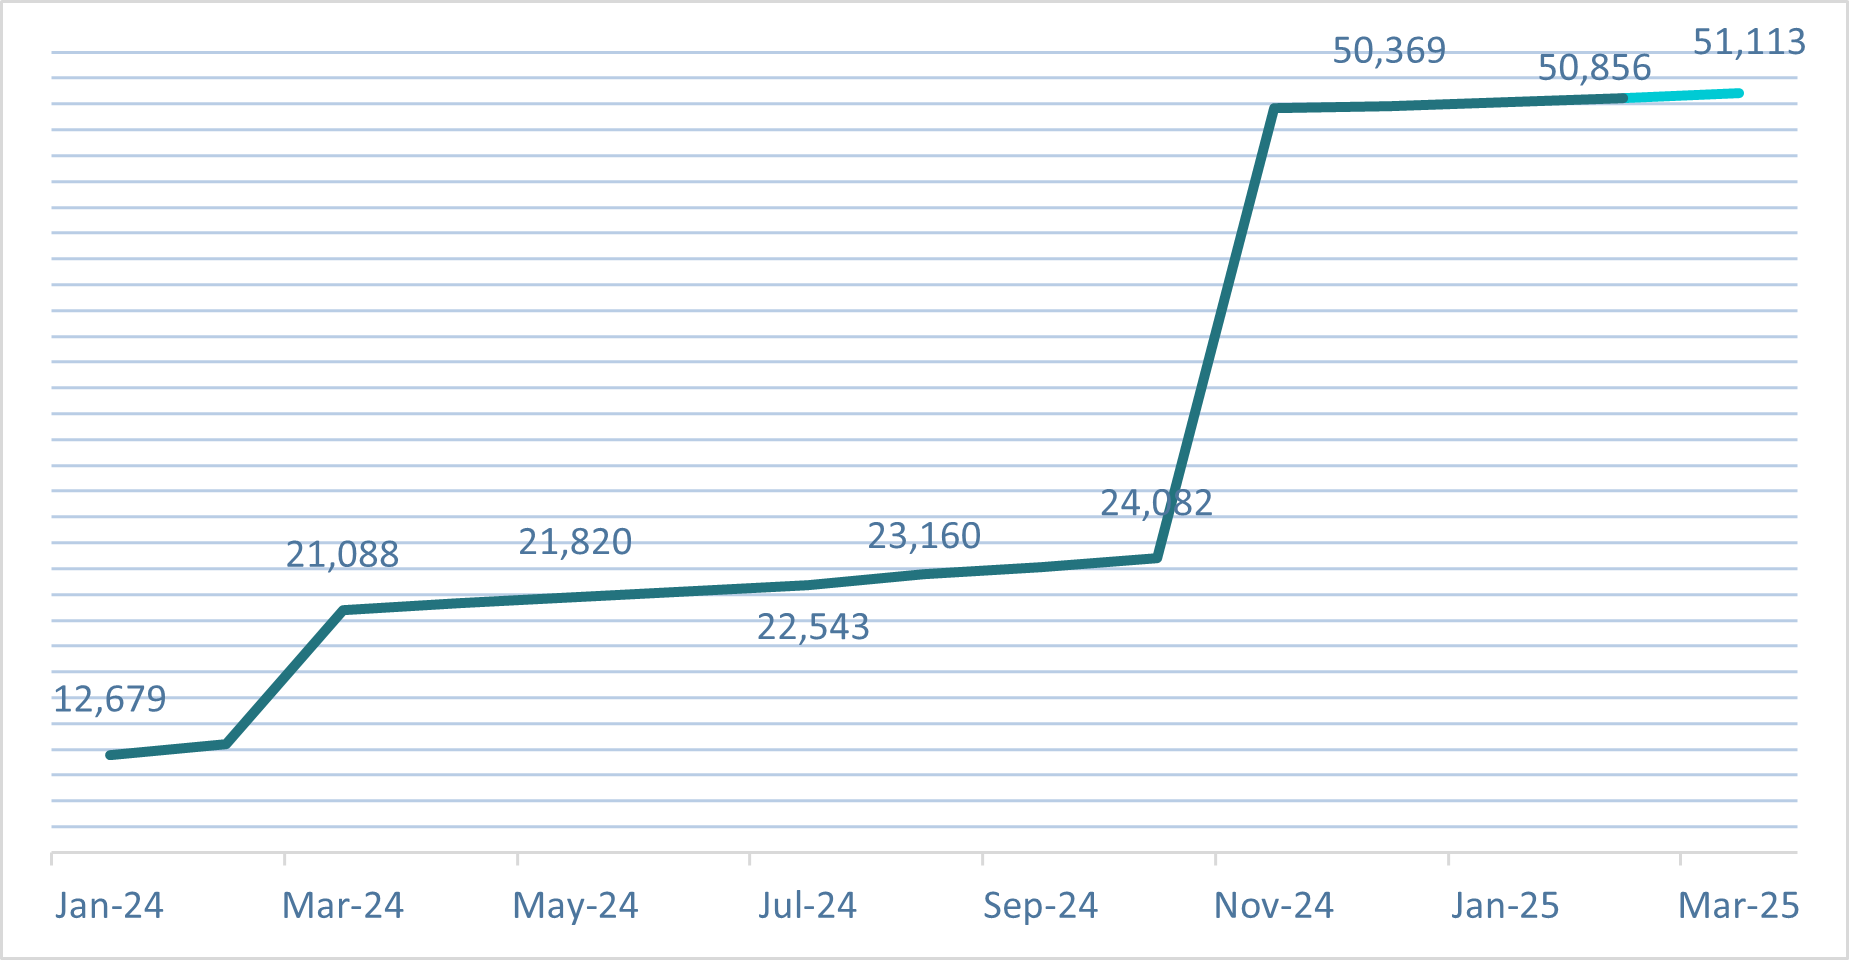
- New businesses registered: 22,174 (+354)
- Month-on-month growth: 1.6%
View chart description and data
A line chart that shows businesses registered from April 2023 to June 2024.
Month |
Per month |
Cumulative |
April 2023 |
366 |
8,297 |
May 2023 |
972 |
9,269 |
June 2023 |
339 |
9,608 |
July 2023 |
374 |
9,982 |
August 2023 |
209 |
10,191 |
September 2023 |
248 |
10,439 |
October 2023 |
218 |
10,657 |
November 2023 |
940 |
11,597 |
December 2023 |
659 |
12,256 |
January 2024 |
423 |
12,679 |
February 2024 |
592 |
13,271 |
March 2024 |
7817 |
21,088 |
April 2024 |
375 |
21,463 |
May 2024 |
375 |
21,820 |
June 2024 |
354 |
22,174 |
eInvoices received (monthly)
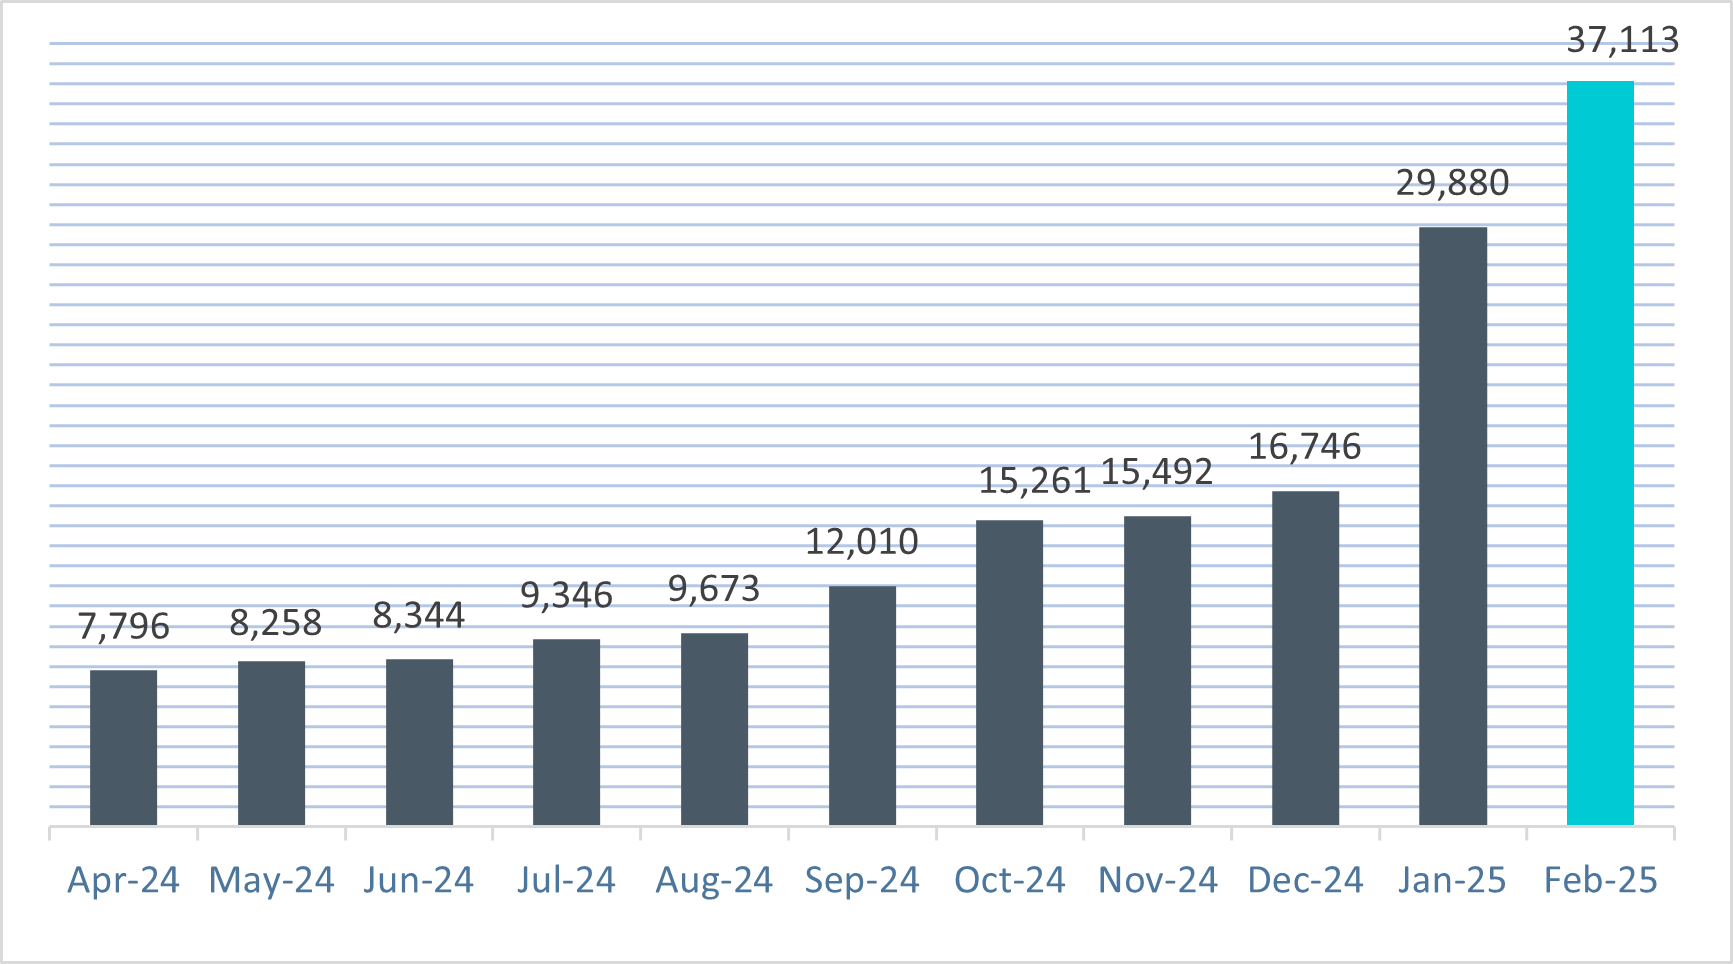
- Received this month: 8,258 (+462) +6%
- Active senders: 542
- Cumulative eInvoices received: 82,123
View chart description and data
A bar chart that shows eInvoices received from July 2023 to May 2024.
Period |
Quantity |
Movement |
Volume growth |
Cumulative |
July 2023 |
3,164 |
497 |
19% |
28,427 |
August 2023 |
2,865 |
287 |
11% |
31,292 |
September 2023 |
2,975 |
110 |
4% |
34,267 |
October 2023 |
3,296 |
321 |
11% |
37,563 |
November 2023 |
4,482 |
1186 |
14% |
42,045 |
December 2023 |
5,051 |
569 |
13% |
47,096 |
January 2024 |
4,851 |
-189 |
-16% |
51,936 |
February 2024 |
6,872 |
2021 |
42% |
58,808 |
March 2024 |
7,261 |
386 |
6% |
66,069 |
April 2024 |
7,796 |
535 |
7% |
73,865 |
May 2024 |
8,258 |
462 |
6% |
82,123 |
Central government agencies and businesses registered to receive eInvoices
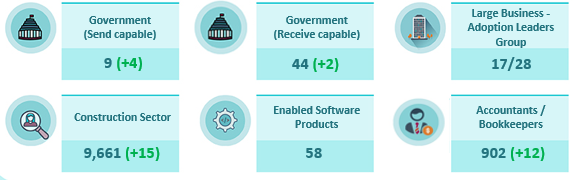
View infographic description and data
Infographic showing the number of central government agencies and businesses registered to receive eInvoices for key sectors/groups for June 2024:
- Central government: 25 of 32
- Accountants/bookkeepers: 705 (+17)
- Large Business Adoption Leader’s Group: 17 of 32
- Recruitment sector: 139
- Enabled software products: 55
- Construction sector: 3,840 (+40)
Sign up, to stay ahead
If you’re a business owner, accountant, business advisor or manager – or you just want to stay in front of the eInvoicing curve – sign up here for email updates, seminar/webinar invitations, and tips to get maximum value from eInvoicing.
Subscribe
Last updated: 10 July 2024